


Streamlit Dashboards Give Data Scientists More Time for Analysis
- June 30, 2021
SuperSet and Streamlit
After the company’s initial research, two solutions, namely SuperSet and Streamlit, were shortlisted. Ultimately, both solutions were chosen and co-exist within the company today. SuperSet is hosted and supported by the cloud team and Streamlit is being used by developers and the data scientist organization. SuperSet was chosen for the cloud team as it offers robust visualization and allows for rich data exploration. Yet, Streamlit shined in its simplicity and ease of use and was therefore selected as the tool of choice for developers and data scientists.
What is Streamlit?
Streamlit is an open-source Python library that makes it easy to build custom web applications for ML and data science. It is a simple and powerful application that lets users build rich UIs incredibly quickly, which gave our customer an ideal way to create dashboards to visualize and analyze their ML models without spending weeks on the project.
Building the Streamlit dashboard
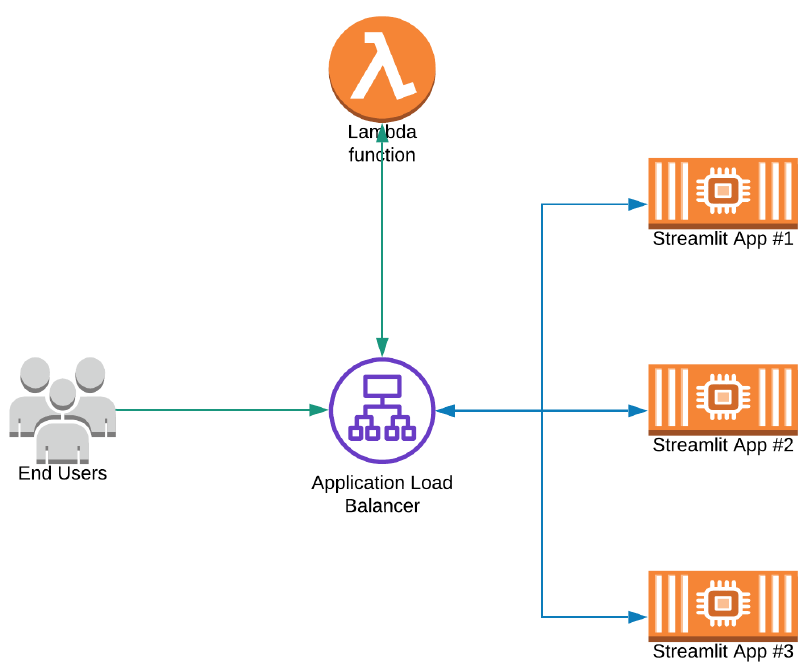
Streamlit is a Python application, which means all the typical methods (EC2, containers etc.) used to host a Python app are valid for Streamlit as well. To simplify the deployment and scalability of the solution for our customer, we chose Amazon ECS to host the Streamlit application containers.
As you can see, each Streamlit app runs as a separate container in the ECS cluster. An Application Load Balancer is used as the entry point for end users and any request hitting the root of the domain is forwarded to a Lambda which dynamically generates a welcome page.
To meet the architecture requirements, we used a mix of provisioning tools. To get started, we created an AWS CloudFormation template that enables us to stand up the Terraform prerequisites required for the Streamlit app build and deployment. The stack deploys with a Terraform state bucket, Terraform state DynamoDB, a Streamlit artifacts bucket and a Streamlit ECR repository. To automate the process of standing up this solution, we developed a Terraform module and associated Jenkins pipeline.
Building and deploying the Streamlit solution
The solution uses a Jenkins pipeline that performs the following steps:
- Invokes Terraform.
- Computes the digest associated with the latest image in ECR.
- Make necessary ECS API calls to create/update ECS services.
- Computes the digest associated with the latest image in ECR.
- Performs Terratest.
- Reads the Terraform outputs from state.
- Waits for the ECS services to stabilize and complete deployments.
- Hits each app until it a 200 response is received.
- Reads the Terraform outputs from state.
Performance testing
Once we built and deployed the solution, we conducted a performance test. In the process, we observed that Streamlit uses a combination of HTTP and WebSocket connections. Static contents such as scripts and fonts are fetched via HTTP whereas dynamic assets like graphs are served over a WebSocket connection. It’s important to understand the difference -- especially when you start thinking about horizontally scaling Streamlit apps – as HTTP is stateless which means the client connection is closed after the request has been completed. Conversely, WebSocket is an active two-way connection between the client and the service.
To test WebSocket connections, we used Jmeter. Because Jmeter doesn’t support the WebSocket protocol out of the box, we installed a third-party plugin. To further enable testing and cross origin requests, we:
- Disabled CORSfor which we need to pass the following CLI argument to streamlit--server.enableCORS=false.
- Disabled XSRFprotection for which we need to pass the following CLI argument to streamlit--server.enableXsrfProtection=false.
Note that you need to update the Streamlit Terraform module to pass in these extra CLI arguments in the entry point section.
From here we conducted two test scenarios. First, we load tested a single instance of the application. In our testing, we experienced app performance degradation with concurrent users. We suspect the issue is with Streamlit trying to create a Watcher for files in the server. We tried disabling the creation of Watcher, but it didn’t respond as expected.
In the second scenario we deployed 100 apps, testing the ability of the architecture to support up to 100 apps. Currently, AWS has a hard limit of 100 target groups per load balancer; our architecture was able to support 99 applications, as expected.
Monitoring and alerting
Last, we set up monitoring and alerting for our Streamlit apps using Amazon CloudWatch. We set up two alarms per Streamlit app and an additional two alarms for the entire cluster.
Application alarms are configured to alert when average CPU utilization exceeds a threshold for more than five minutes and when the average memory utilization exceeds our specified threshold for more than five minutes. Cluster alarms are configured to notify when the cluster ASG capacity reaches (n - 1), where n is the max size and, naturally, when a Streamlit app crashes. Whenever an alarm is triggered, Amazon CloudWatch sends the event to an SNS topic which is then forwarded to Slack by a chatbot.
Data scientist benefits
With the new Streamlit dashboard solution, our customers’ data scientists and developers now have a self-service model to provision internal dashboards for their specific needs. All without having to worry about the time intensive process of provisioning instances and supporting assets. This allows the research team to spend less time on tactical work and more time assessing and analyzing the outcomes of their complex ML models, unearthing findings that propel the business forward.
Read more about data analytics, machine learning and the cloud in our Tech Blog. Subscribe below.
Subscribe to our blog